TL;DR
A slow PostgreSQL query almost always traces back to one of five causes: a missing or unused index, a bad plan from stale statistics, lock waits, table/index bloat, or memory and I/O limits. Measure first with pg_stat_statements, then read EXPLAIN ANALYZE, check pg_stat_activity for blocking, and only then tune settings or reindex. This guide walks through each cause with concrete diagnostics.
Introduction
Every engineer who has run a production database eventually types the same desperate search: why is my PostgreSQL query slow? The query worked in staging, returns ten rows, and suddenly takes 45 seconds in production. Or it was fast yesterday and is slow today with no code change.
The good news: when a postgres query is taking too long, the root cause almost always falls into one of a handful of categories. This guide is a practical, ordered troubleshooting path — measure first, diagnose second, fix third — so you can identify the root cause instead of guessing at configuration knobs.
If you want to go deeper on any single tool mentioned here, we have dedicated guides on reading PostgreSQL EXPLAIN ANALYZE and the PostgreSQL query planner. This article focuses on the diagnostic flow that ties them together.
First: Confirm What 'Slow' Actually Means
Before touching anything, establish where the time is going. "Slow" can mean execution time, wait time, or network round-trips — and the fix differs for each.
Execution time vs wait time
A query can be slow for two very different reasons:
- Execution time: the database is actively working — scanning rows, sorting, joining.
EXPLAIN ANALYZEshows you exactly where this time goes. - Wait time: the query is queued behind locks, I/O, or resource contention.
EXPLAIN ANALYZEwill look perfectly reasonable because the query itself is fine.
Rule of thumb: if EXPLAIN ANALYZE execution time matches the wall-clock time you observe, it's an execution problem. If the plan says 30 ms but the query takes 30 seconds, you're waiting on something else — usually locks.
Using pg_stat_statements to spot the worst offenders
When you're not debugging a single query but asking "which queries should I look at?", enable the pg_stat_statements extension:
CREATE EXTENSION IF NOT EXISTS pg_stat_statements;
Note: pg_stat_statements requires shared_preload_libraries = 'pg_stat_statements' in postgresql.conf and a server restart before it collects data.
Then find the heaviest queries by total time:
SELECT query,
       calls,
       round(total_exec_time::numeric, 1) AS total_ms,
       round(mean_exec_time::numeric, 1) AS mean_ms,
       rows
FROM pg_stat_statements
ORDER BY total_exec_time DESC
LIMIT 10;
These column names are current as of PostgreSQL 13; on older versions, total_exec_time and mean_exec_time were named total_time and mean_time.
High total_exec_time with many calls means a small per-query improvement pays off across the whole system. High mean_exec_time on a rarely-called query points to a specific problem statement. Pair this with log_min_duration_statement in the server config to capture individual slow statements in the log as they happen.
Cause 1: Missing or Unused Indexes
The most common cause of a slow PostgreSQL query is also the simplest: the planner had no suitable index and fell back to a sequential scan.
Spotting sequential scans in the plan
EXPLAIN ANALYZE
SELECT * FROM orders WHERE customer_id = 42 AND status = 'shipped';
If you see Seq Scan on orders with rows removed by filter: 9998500, the database read ten million rows to return twenty. On a small table a sequential scan is fine — it's only a smell when the table is large, the filter is selective, and the query runs often.
Fixes, in order of preference:
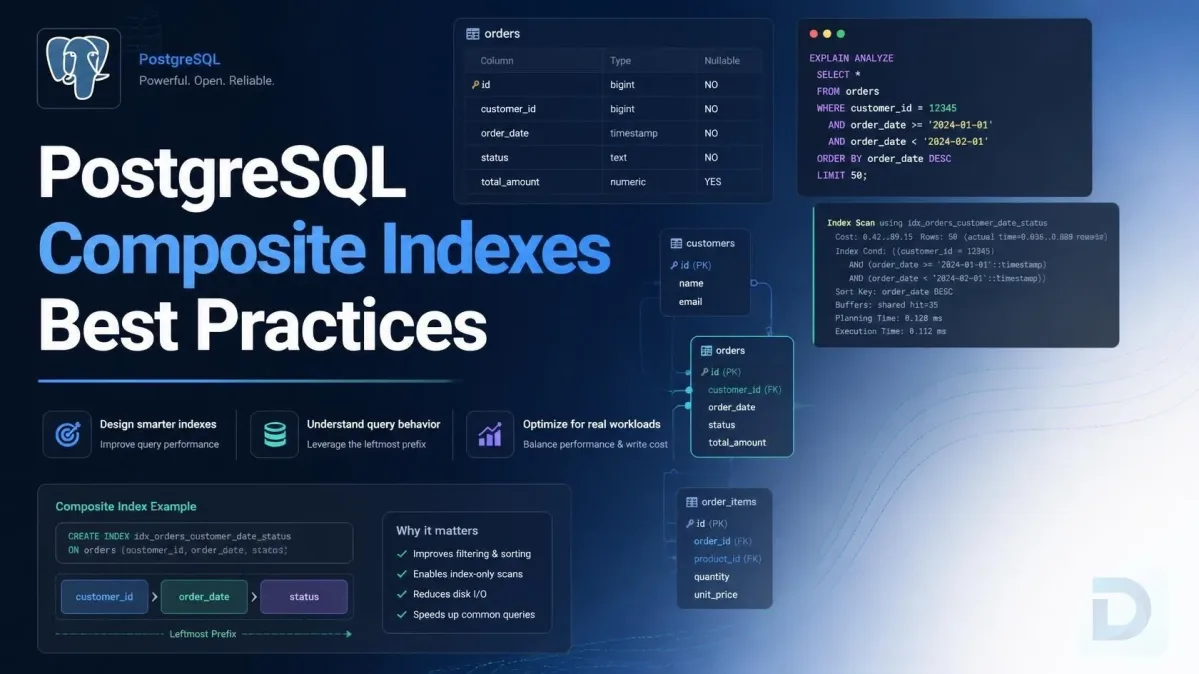
- Create an index matching the query's most selective columns. For multi-column filters, a composite index ordered correctly usually beats two single-column indexes.
- If the query selects only a few columns, consider a covering index so the planner can use an index-only scan.
- Verify with
EXPLAIN ANALYZEthat the planner now picks the index. If not, see the next section.
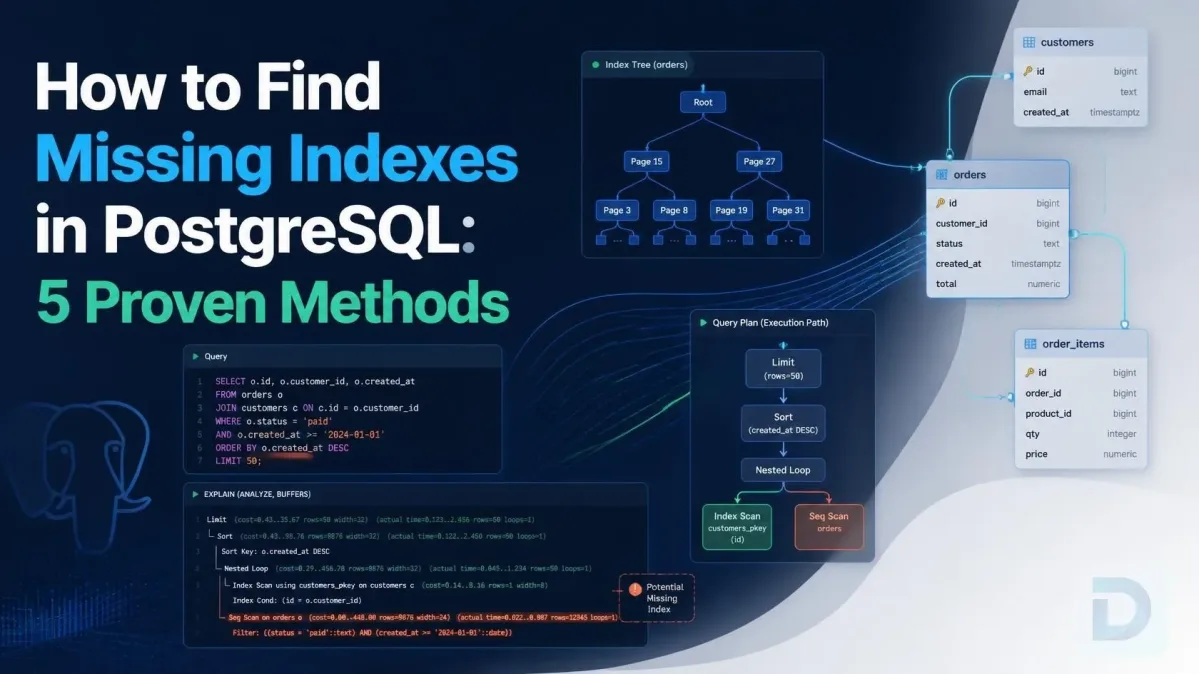
Our guide on finding missing indexes in PostgreSQL covers systematic methods, including mining pg_stat_statements for repeated sequential scans.
Why an existing index may be ignored
An index that exists but isn't used usually has a fixable reason:
- Functions or casts on the indexed column:
WHERE upper(email) = ...can't use a plain index onemail. Use an expression index matching the predicate. - Leading-column mismatch: a composite index on
(a, b)helps filters ona, but not onbalone. - Low selectivity: if the filter matches 60% of the table, a sequential scan genuinely is faster. The planner is right; see our index scan vs sequential scan comparison.
- Outdated statistics: the planner doesn't know the index would help. Run
ANALYZE.
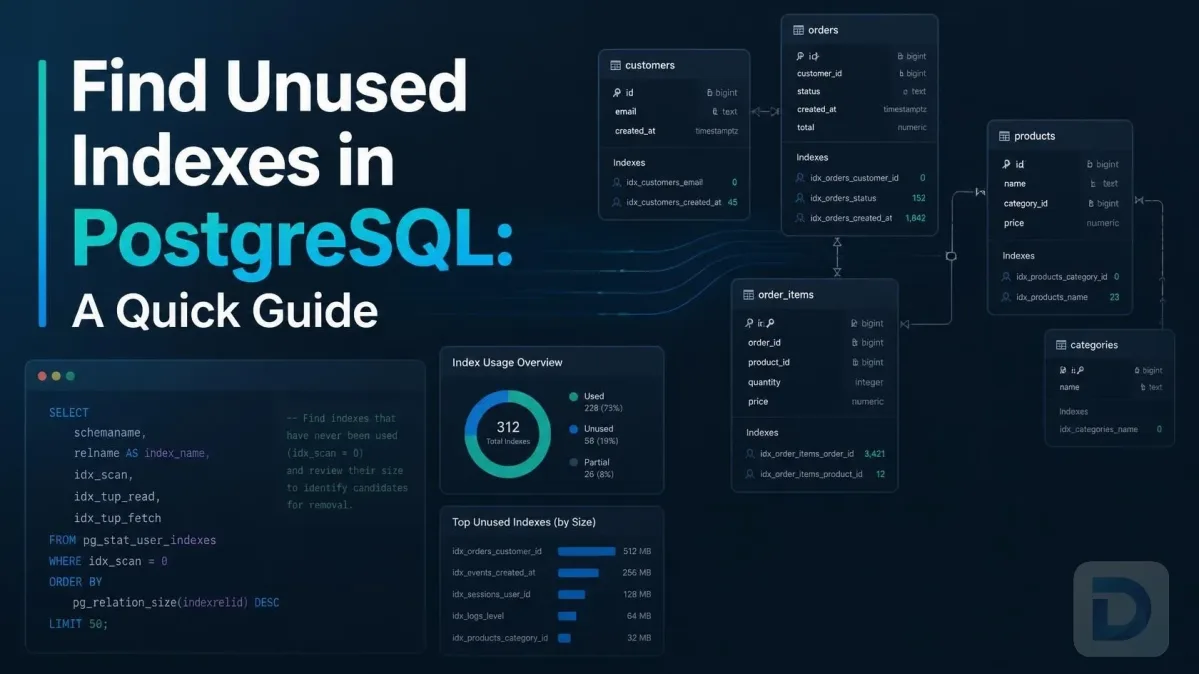
If you suspect dead weight rather than a gap, our guide on finding unused indexes in PostgreSQL shows how to identify indexes that never get picked.
Cause 2: The Planner Chose a Bad Plan
Sometimes the index exists and the plan still looks wrong — a nested loop over millions of rows, a hash join on wildly wrong cardinalities, or a sort spilling to disk when everything should fit in memory.
Stale statistics and row misestimates
The planner chooses join strategies and scan types based on statistics collected by ANALYZE. When those statistics are stale — after a bulk load, a mass delete, or a long window with autovacuum falling behind — row estimates can be off by orders of magnitude.
You'll see it directly in EXPLAIN ANALYZE: the rows= estimate at some node differs wildly from rows= actual. A plan built on an estimate of 50 rows that actually processes 500,000 will pick the wrong join and the wrong scan.
Run ANALYZE tablename; and re-examine the plan. On tables with highly skewed data distributions, consider raising the statistics target for the relevant columns:
ALTER TABLE orders ALTER COLUMN status SET STATISTICS 500;
ANALYZE orders;
The official documentation on planner statistics explains how estimates are built and when they go wrong. For a deeper dive into how the planner makes these decisions, see how the PostgreSQL query planner works.
Fixing estimates with better predicates
Misestimates also come from the query itself:
- Wrapping columns in functions (
WHERE date(created_at) = ...) hides the value from the planner. Rewrite as a range:WHERE created_at >= ... AND created_at < .... - Implicit type casts between text and numeric columns defeat both indexes and statistics.
- Correlated columns the planner assumes are independent can compound errors. PostgreSQL supports extended statistics (
CREATE STATISTICS) for exactly this case.
Cause 3: Lock Waits and Blocking Sessions
When the plan looks fine but the query still hangs, you're probably waiting on a lock. This is the classic "it's fast when I run it alone, slow in production" pattern.
Detecting blocking queries
Query pg_stat_activity to see what every session is doing right now:
SELECT pid, state, wait_event_type, wait_event,
       now() - query_start AS duration,
       left(query, 80) AS query
FROM pg_stat_activity
WHERE state <> 'idle'
ORDER BY duration DESC;
A session stuck in wait_event_type = 'Lock' is blocked by another. To trace the blocking chain, join on pg_locks to find which PID holds the lock — the lock monitoring docs include a ready-made blocking-locks query you can adapt.
Idle in transaction and long-running DDL
Two production classics:
idle in transactionsessions: an application opens a transaction, does work, and never commits. Its locks persist, and it also holds back vacuuming. Setidle_in_transaction_session_timeoutand audit application transaction handling.- Long-running DDL:
ALTER TABLEon a hot table can queue behind every open transaction — and, worse, every subsequent query queues behind it. If you must run DDL on a busy table, use the short lock timeouts (lock_timeout) plus retries pattern, and schedule it off-peak.
The fix is rarely "add a bigger lock timeout." It's finding who is holding the lock and shortening their transaction.
Cause 4: Table and Index Bloat
PostgreSQL doesn't remove dead rows immediately. Updates and deletes leave dead tuples behind until vacuuming reclaims the space. Until then, scans read more pages than the live data justifies, and indexes accumulate entries that point nowhere — this is bloat.
Dead tuples and why autovacuum falls behind
Autovacuum normally keeps up, but it can fall behind on write-heavy tables: very large tables can exhaust the limited autovacuum workers, tables with heavy churn regenerate dead tuples faster than vacuum clears them, or long-running transactions prevent cleanup entirely.
Check the current state:
SELECT relname, n_dead_tup, n_live_tup,
       last_autovacuum, last_autoanalyze
FROM pg_stat_user_tables
WHERE n_dead_tup > 0
ORDER BY n_dead_tup DESC
LIMIT 10;
A high n_dead_tup relative to n_live_tup on a frequently scanned table is a strong bloat signal. Our guide on PostgreSQL index internals explains why indexes bloat even harder than tables.
When to VACUUM, and when to REINDEX
- Plain
VACUUMreclaims dead tuples for reuse within the table. It's online and cheap — runVACUUM ANALYZEto also refresh planner statistics (see Cause 2). The routine vacuuming docs cover the mechanics. REINDEX CONCURRENTLY(available since PostgreSQL 12) rebuilds an index when it has grown far beyond its live data size. It doesn't take an exclusive lock, but it does double storage temporarily.- Truly bloated tables where space must be returned to the OS require heavier approaches (such as
VACUUM FULLor logical rebuilds) that take stronger locks — plan for a maintenance window and test first. Don't run these casually on a production primary.
Cause 5: Memory, Cache, and I/O Limits
Sometimes the plan is right, there are no locks, and the table isn't bloated — the query is simply doing a lot of work and hitting resource limits.
Cold cache vs warm cache runs
PostgreSQL caches frequently accessed pages in shared buffers and the OS page cache. A query run right after a deploy, a failover, or a restart reads from disk instead of memory and can be dramatically slower than the same query ten minutes later. This is why "it's slow on the first run" is often not a bug at all.
You can see it in EXPLAIN (ANALYZE, BUFFERS): compare shared hit versus shared read between a warm and cold run. A high read count on a hot query means the working set doesn't fit in cache — a tuning or hardware conversation, not a query rewrite.
work_mem spills and disk sorts
When a sort or hash table doesn't fit in work_mem, PostgreSQL spills to temporary disk files. In EXPLAIN ANALYZE you'll see something like Sort Method: external merge Disk: 256000kB — a clear signal that the operation exceeded the memory budget.
Raising work_mem helps, but apply it precisely: it's allocated per sort/hash operation, per session, so a session-level SET work_mem for known-heavy reporting queries is safer than a global increase on a server with many concurrent connections.
If a single node dominates execution time with a spill and the data set is genuinely large, also ask whether the query could be narrowed first — less data flowing into the sort beats any memory setting.
For a structured next step after fixing a specific query, our PostgreSQL query optimization guide covers the full workflow end to end.
A Repeatable Troubleshooting Checklist
When a postgres query is taking too long, work through this order — the flow below summarizes the diagnostic path:
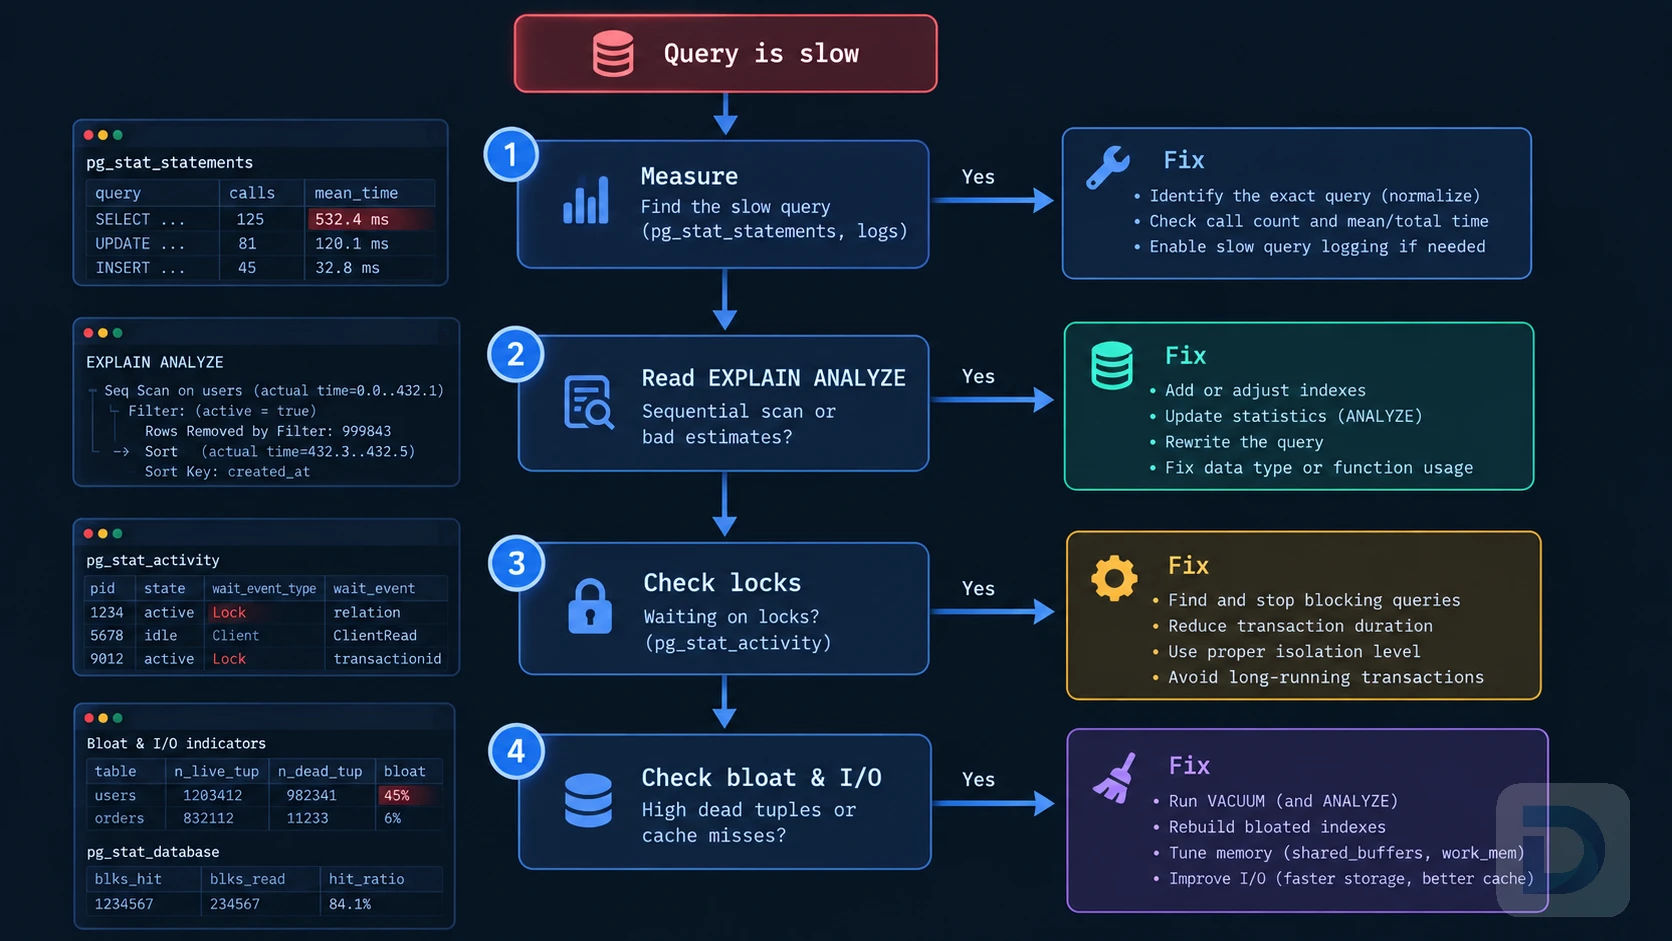
Diagnostic flow: from 'query is slow' to the most likely root cause.
- Measure. Enable
pg_stat_statementsandlog_min_duration_statementso you're working with data, not anecdotes. - Compare plan time to wall-clock time. If they roughly match, the problem is execution — continue with step 3. If not, the query is waiting, not working — go directly to step 5.
- Run
EXPLAIN (ANALYZE, BUFFERS). Look for sequential scans on large tables, sort spills, and estimate-vs-actual row mismatches. Fix indexes and statistics accordingly. - Check bloat. High
n_dead_tupon a hot table →VACUUM ANALYZE; oversized indexes →REINDEX CONCURRENTLY. - Check waits. Inspect
pg_stat_activityfor lock waits,idle in transactionsessions, and long-running blockers. Once the blocker is resolved, return to steps 3–4 for any queries that are genuinely slow even when unblocked. - Check resources last. Cache misses and memory settings matter, but they're the diagnosis of exclusion — resolve execution and lock issues before tuning memory or hardware.
Key Takeaways
- Measure before tuning:
pg_stat_statementsfinds the queries;EXPLAIN ANALYZEfinds the cause. - Match plan time to wall-clock time to separate execution problems from lock waits.
- In practice, the most frequent root causes are missing or unused indexes and stale statistics — start there.
- Bloat is gradual: watch
n_dead_tupand act before scans degrade. - Resource tuning (
work_mem, cache sizing) is the last lever, not the first.
Conclusion
The question "why is my PostgreSQL query slow?" has a finite set of answers, and a repeatable path to each one. Resist the urge to jump straight to configuration changes — in our experience, an index that matches the query, fresh statistics, and a clean lock situation resolve the overwhelming majority of cases.
Build the habit: capture slow statements, read the plan with real timings, check for blockers, and keep vacuuming healthy. The tools above run on any PostgreSQL instance and take minutes to set up — the payoff is turning a stressful incident into a ten-minute diagnosis.
FAQ
Enable the pg_stat_statements extension and query the pg_stat_statements view ordered by total_exec_time or mean_exec_time. Combine it with log_min_duration_statement to capture individual slow statements in the server log. Tip: call pg_stat_statements_reset() before a test window so the statistics reflect only the period you're investigating.
Common reasons include a cold buffer cache on the first run, the planner switching plans due to changing parameter values or statistics, lock contention with other sessions, or autovacuum running concurrently and consuming I/O.
Yes. EXPLAIN ANALYZE runs the statement and reports real timings, so use EXPLAIN alone for INSERT, UPDATE, or DELETE, or wrap the statement in a transaction and roll back to avoid changing data.
VACUUM reclaims dead tuples, which reduces table and index bloat and helps scans and index lookups. VACUUM ANALYZE also refreshes planner statistics, which can lead to better query plans. If autovacuum is repeatedly falling behind on a hot table, tune its per-table settings (for example, lower autovacuum_vacuum_scale_factor) rather than running manual vacuums on a schedule.
There is no fixed threshold, but if a frequent query does a sequential scan over a large table to return few rows, an index usually helps. Always weigh the read gain against write overhead and storage cost, and verify the improvement with EXPLAIN ANALYZE.
About the author

Founder & Lead Developer at DBO Studio
Full-stack developer and creator of DBO Studio, a modern database management tool. Passionate about PostgreSQL, MySQL, SQLite, database performance, developer productivity, and building tools that simplify database workflows.
Try this in DBO Studio
Explore PostgreSQL workflows visually in DBO Studio — schemas, queries, and plans in one place.
Our newsletter
Subscribe to DBO Studio’s newsletter for exclusive tutorials, tips & product updatesRelated posts