Understanding PostgreSQL index scan vs sequential scan behavior is fundamental to query performance tuning. The PostgreSQL query planner does not blindly use an index just because one exists. It estimates the cost of each scan method based on table statistics, storage characteristics, and configuration parameters. This article explains how both scan types work, when each wins, and how to diagnose and influence the planner's choice with confidence.
TL;DR: Sequential scans read the entire table page by page and are efficient for large result sets. Index scans traverse a B-tree and fetch matching heap tuples, which is faster for selective queries but can become expensive when many rows match. The planner picks the cheaper estimated option using parameters like
random_page_costandeffective_cache_size. UseEXPLAIN ANALYZEto verify actual behavior before tuning.
Introduction
Every PostgreSQL query that reads rows from a table must choose an access method. The two most common are the sequential scan and the index scan. A third variant, the bitmap heap scan, sits between them and is often overlooked.
The choice between a PostgreSQL index scan vs sequential scan is rarely a moral one. Sequential scans are not inherently bad, and index scans are not always faster. The right answer depends on selectivity, table size, storage hardware, cache state, and whether the table is bloated or freshly vacuumed.
In this guide you will learn:
- How each scan type physically reads data
- How the PostgreSQL query planner estimates and compares costs
- How to read
EXPLAIN ANALYZEoutput for scan nodes - Which configuration parameters influence the decision
- Practical tuning steps for production workloads
How PostgreSQL Executes a Sequential Scan
A sequential scan reads every block in the table's heap file from start to finish. PostgreSQL uses the table's visibility map to skip pages that are known to contain no visible tuples, but in the worst case every page must be read.
Heap access and page-by-page reads
PostgreSQL stores rows in 8 KB pages. A sequential scan issues read requests for consecutive pages, which modern storage handles efficiently through read-ahead and larger I/O operations. On spinning disks this is especially important because sequential I/O avoids expensive disk seeks.
During a sequential scan, PostgreSQL applies filter conditions to each row after reading it. Rows that do not match are discarded. The scan does not require an index, so it works for any query regardless of which columns are filtered or how they are ordered.
When sequential scans outperform index scans
A sequential scan is often the best choice when:
- The query returns a large fraction of the table, typically more than 5–20% depending on hardware
- The table is small enough to fit in shared buffers
- The query reads many columns not covered by an index
- The table has heavy bloat that would inflate heap fetch costs for an index scan
- The workload is I/O bound and sequential read throughput matters more than latency
If you run an aggregate over an entire table, for example SELECT count(*) FROM events, a sequential scan is usually correct. Forcing an index scan in that case would likely increase total I/O and slow the query down.
How PostgreSQL Executes an Index Scan
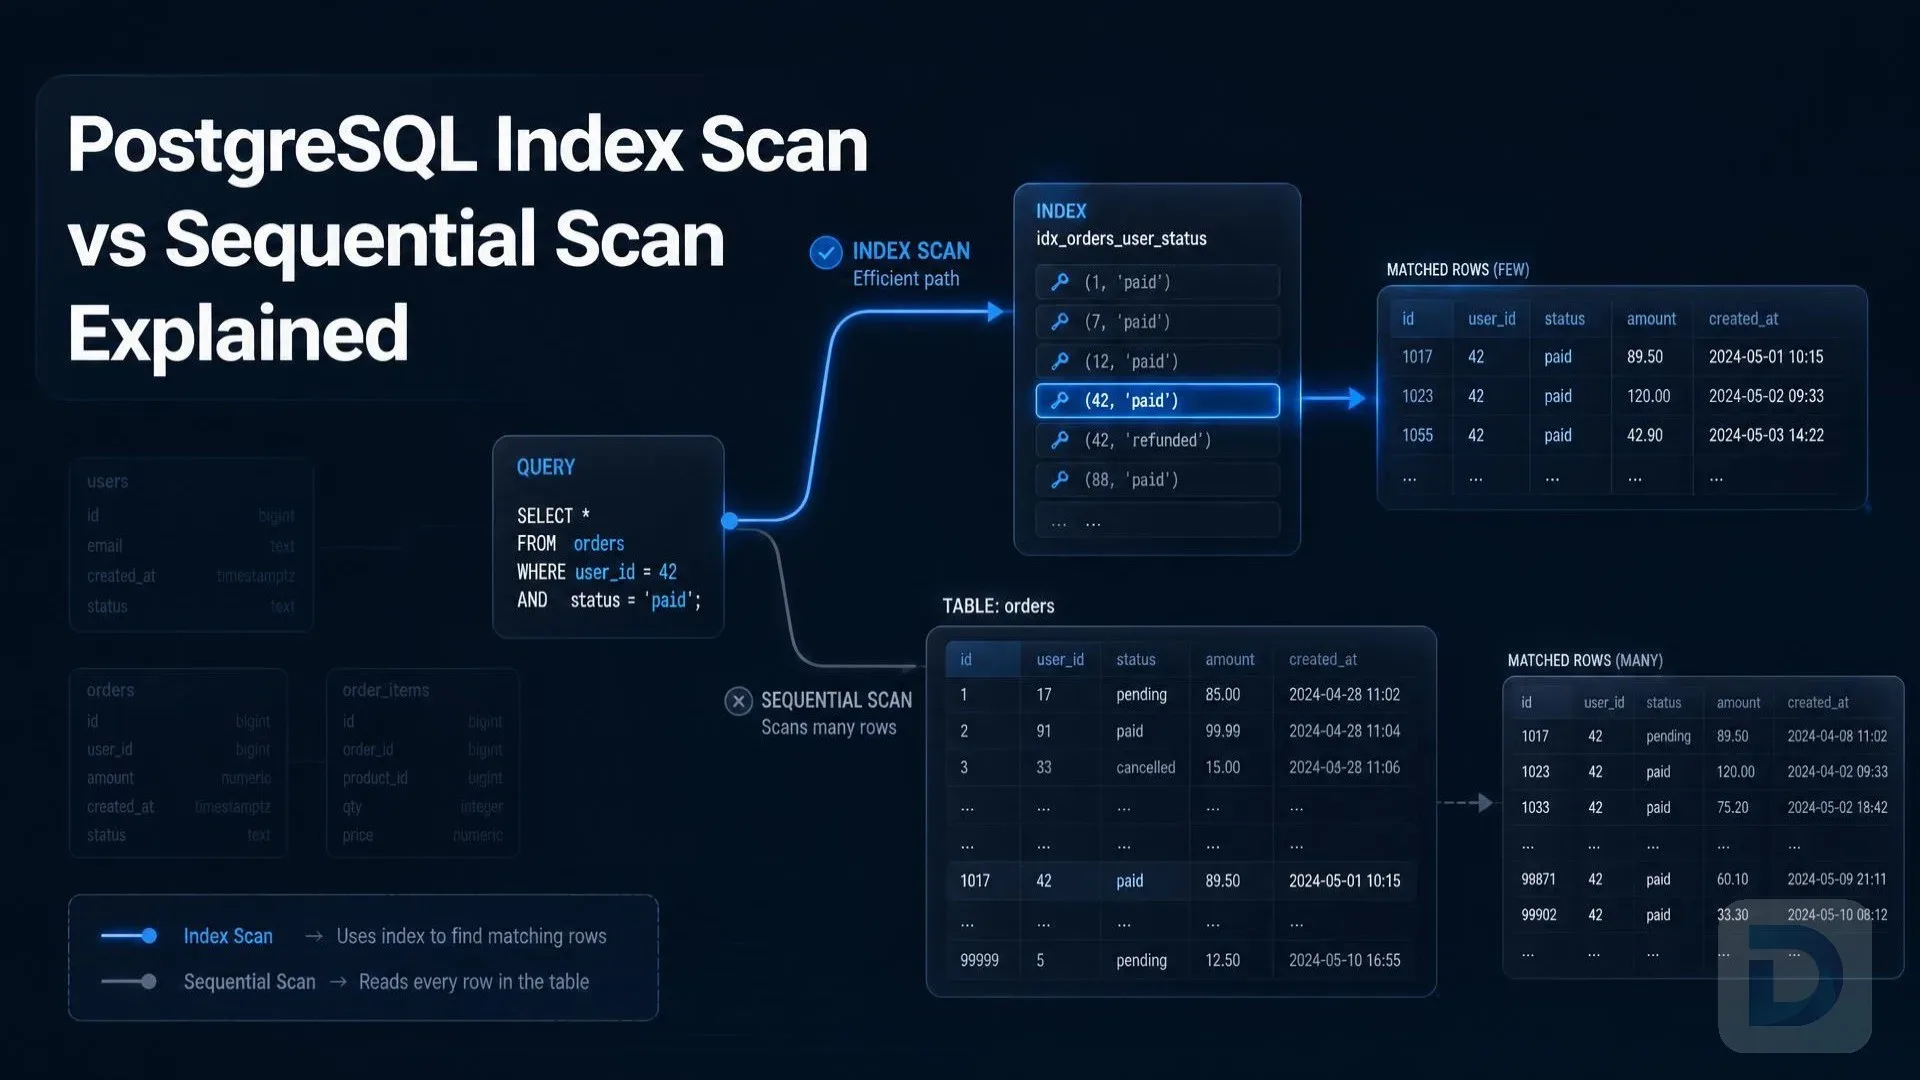
An index scan uses a B-tree or other index structure to locate rows that match a condition, then fetches the corresponding heap tuples. This is efficient when the predicate is selective and only a small number of rows must be retrieved.

B-tree index traversal followed by heap tuple fetches in PostgreSQL.
B-tree traversal and heap tuple fetches
The default PostgreSQL index type is the B-tree. A B-tree is balanced, meaning the distance from root to leaf is the same for every leaf node. For an equality lookup, PostgreSQL traverses from the root page down through branch pages to a leaf page. The leaf contains index entries that point to heap tuples via physical block and offset.
Those heap fetches are the expensive part. If the matching rows are scattered across many different heap pages, each fetch may require a separate random read. This is why an index scan that returns thousands of rows can be slower than a sequential scan on the same query.
Index-only scans and the visibility map
An index-only scan avoids heap fetches entirely when all requested columns are present in the index and the visibility map says every tuple on the target heap page is visible to all transactions. PostgreSQL still checks the visibility map to avoid fetching stale or invisible rows.
This makes index-only scans dramatically faster than regular index scans for workloads like SELECT user_id FROM events WHERE created_at > now() - interval '1 day' when a covering index exists on (created_at, user_id). Without the second column, the index scan would still need to visit the heap to fetch user_id.
Bitmap heap scans as a middle ground
A bitmap heap scan builds a bitmap of matching heap pages from an index scan, then reads those pages in physical order. This combines the selectivity of an index with the sequential-read friendliness of a heap scan.
The bitmap heap scan is particularly useful for moderately selective queries, such as filtering a few percent of a large table. By sorting heap fetches by page number, PostgreSQL avoids repeated random reads to the same page. It also allows the executor to use a larger work_mem setting to keep the bitmap structure in memory.
How the Query Planner Chooses Between Index and Sequential Scans
The PostgreSQL query planner is cost-based. It generates possible plans, estimates their execution cost, and picks the cheapest one. Scan choice is a direct result of that cost model.
Cost model basics: random_page_cost, seq_page_cost, cpu_tuple_cost
Three configuration parameters dominate scan cost estimation:
| Parameter | Default | Meaning |
|---|---|---|
seq_page_cost | 1.0 | Cost of reading one page during a sequential scan |
random_page_cost | 4.0 | Cost of fetching one page via random access |
cpu_tuple_cost | 0.01 | CPU cost of processing one row |
The default value of random_page_cost is 4.0 because traditional spinning disks take roughly four times longer to perform a random read than a sequential read. On modern SSDs and cloud block storage, that ratio is often closer to 1.1 or 1.5.
If random_page_cost is too high, the planner will avoid index scans even when they would be faster. If it is too low, the planner may choose index scans that cause excessive random I/O.
Selectivity, row estimates, and cardinality
Selectivity is the fraction of rows a predicate is expected to match. PostgreSQL stores column-level statistics in pg_statistic and per-table row counts in pg_class.reltuples. The planner uses these to estimate how many rows will match a given condition.
If the estimated row count is wrong, the scan choice will be wrong too. This happens when:
- Statistics are stale after a large bulk insert or delete
- Data distribution is skewed and the default histogram is insufficient
- The query contains expressions or functions that prevent statistics use
- The table has grown or shrunk dramatically without an
ANALYZE
The role of effective_cache_size
effective_cache_size tells the planner how much data is likely to be in the operating system page cache and PostgreSQL shared buffers combined. It does not allocate memory. It only influences cost estimates.
When the planner believes a table or index is already cached, it reduces the estimated cost of reading it. A higher effective_cache_size makes index scans and repeated index lookups more attractive because the planner assumes fewer actual disk reads will be needed.
Diagnosing Scan Decisions with EXPLAIN ANALYZE
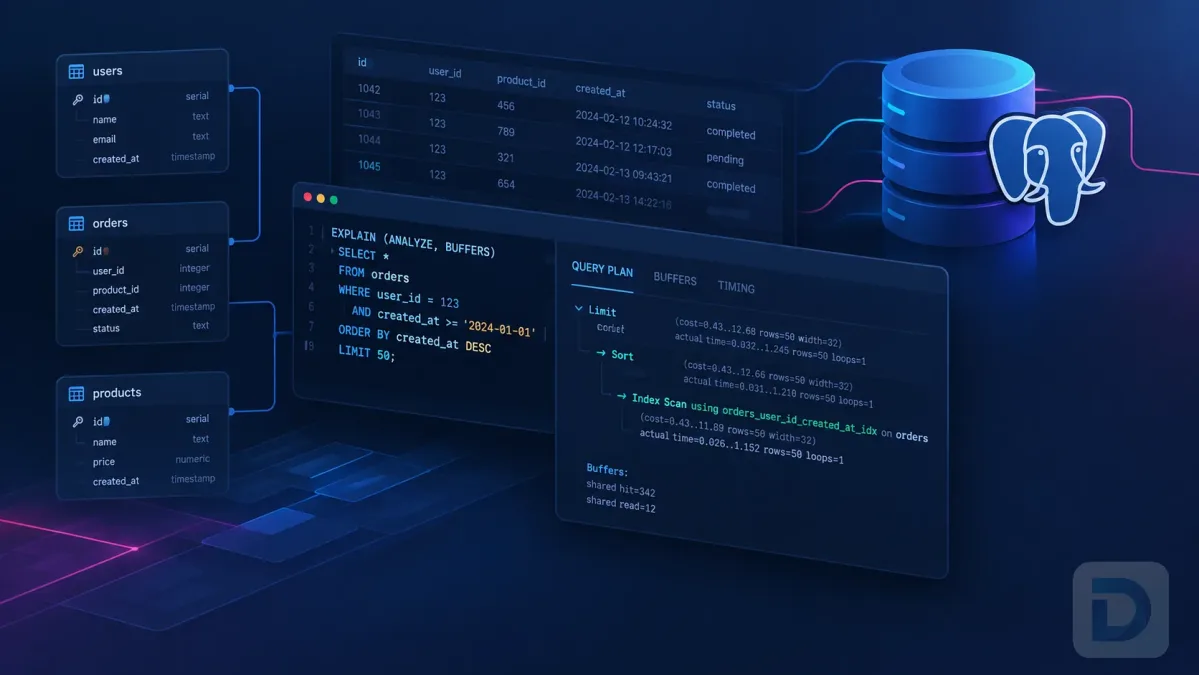
EXPLAIN ANALYZE is the most reliable way to see which scan type PostgreSQL actually used and how well the planner's estimates matched reality.
EXPLAIN (ANALYZE, BUFFERS, FORMAT TEXT)
SELECT *
FROM events
WHERE user_id = 42
ORDER BY created_at DESC
LIMIT 20;
Reading actual vs planned rows
The output contains both rows from the planner's estimate and actual rows from execution. Large mismatches indicate stale or misleading statistics.
For example, an index scan node that estimates rows=10 but reports actual rows=25000 means the planner expected high selectivity but got a flood of heap fetches. The plan may still complete, but a sequential scan might have been faster.
The BUFFERS option shows how many pages were read and whether they came from shared buffers or disk. This is essential for confirming whether effective_cache_size is set appropriately.
Identifying misleading statistics and stale tables
Use pg_stat_user_tables to check when statistics were last updated:
SELECT relname,
       last_analyze,
       last_autoanalyze,
       n_live_tup,
       n_dead_tup
FROM pg_stat_user_tables
WHERE relname = 'events';
A high ratio of dead tuples to live tuples indicates table bloat. Bloat inflates heap size and makes both sequential scans and heap fetches more expensive. Running VACUUM or VACUUM FULL can restore planner accuracy.
If the planner still picks the wrong plan after updating statistics, the issue is likely a configuration problem rather than a statistics problem.
Tuning PostgreSQL to Prefer the Right Scan
Tuning should always follow diagnosis. The goal is not to force a specific scan type, but to make the planner's estimates match physical reality.
Adjusting random_page_cost for SSD vs HDD
On solid-state storage, reduce random_page_cost to between 1.0 and 1.5:
ALTER SYSTEM SET random_page_cost = 1.1;
SELECT pg_reload_conf();
On network-attached or spinning disk storage, keep the default or raise it. The key question is: how much more expensive is a random read than a sequential read on your actual hardware?
Running ANALYZE and maintaining statistics
Run ANALYZE after large data changes:
ANALYZE events;
For very large tables, consider increasing default_statistics_target from its default of 100 to 300 or 500 to get more accurate histograms:
ALTER TABLE events ALTER COLUMN user_id SET STATISTICS 1000;
ANALYZE events;
Keep autovacuum enabled and monitor it. Autovacuum updates statistics and removes dead tuples, both of which keep planner estimates accurate.
Using covering indexes and partial indexes
A covering index includes all columns needed by a query, enabling an index-only scan. For the earlier example:
CREATE INDEX events_user_created_idx
ON events (user_id, created_at)
INCLUDE (event_type);
A partial index reduces index size and improves selectivity:
CREATE INDEX events_active_user_idx
ON events (user_id)
WHERE active = true;
Partial indexes are powerful when queries consistently filter on the same predicate.
When to avoid forcing index scans
Some developers try to force an index scan by disabling sequential scans:
SET enable_seqscan = off;
This is a debugging tool, not a production tuning strategy. It forces the planner to use an index even when a sequential scan would be faster. Use it only to confirm that an index exists and can be used, then remove it and fix the underlying cost parameters instead.
If you want to test a different plan without affecting other sessions, use SET LOCAL inside a transaction rather than changing global settings.
FAQ
Because the planner estimated that a sequential scan would be cheaper. This usually happens when the query matches a large portion of the table, the table is small, or random_page_cost is set too high relative to actual storage performance.
You can set enable_seqscan = off for a session, but this is intended for testing only. The better approach is to run ANALYZE, adjust random_page_cost, or create a more suitable index so the planner chooses the index scan naturally.
An index scan reads index entries and then fetches rows from the heap. An index-only scan reads index entries and returns results without heap fetches because all needed columns are in the index and the visibility map confirms the rows are visible.
No. For large result sets, full table aggregations, and small tables, sequential scans are often the fastest option. Sequential I/O is highly efficient, especially when the table fits in cache.
Run EXPLAIN ANALYZE on the query. The plan output will show nodes like Seq Scan, Index Scan, Index Only Scan, or Bitmap Heap Scan.
random_page_cost controls the planner's assumption about how expensive random page reads are compared to sequential reads. Lower values make index scans more attractive because heap fetches are assumed to be cheaper.
Key Takeaways
- Sequential scans read the entire heap and excel for large result sets and full-table operations.
- Index scans use a B-tree to locate matching rows but can become expensive due to scattered heap fetches.
- Index-only scans avoid heap fetches entirely when the index covers the query and visibility is known.
- Bitmap heap scans combine index selectivity with sequential-friendly heap reads.
- The PostgreSQL query planner chooses based on estimated cost, which depends on
random_page_cost,effective_cache_size, and table statistics. - Always verify with
EXPLAIN ANALYZEbefore changing configuration. - Tune
random_page_costfor your storage, keep statistics fresh withANALYZE, and design covering or partial indexes for hot queries.
Conclusion
Deciding between a PostgreSQL index scan vs sequential scan is not about picking a favorite. It is about understanding what each access method costs on your hardware and workload. The planner usually makes good choices when given accurate statistics and realistic cost parameters.
Start by observing real query plans with EXPLAIN ANALYZE. Fix statistics. Adjust random_page_cost if your storage profile differs from the default. Create indexes that support your actual query patterns instead of fighting the planner.
For day-to-day PostgreSQL development, a modern database GUI like DBO Studio makes it easier to inspect query plans, monitor table statistics, and compare execution behavior without switching between command-line tools. Check the latest releases for recent improvements to the query analysis workflow.
About the author

Founder & Lead Developer at DBO Studio
Full-stack developer and creator of DBO Studio, a modern database management tool. Passionate about PostgreSQL, MySQL, SQLite, database performance, developer productivity, and building tools that simplify database workflows.
Try this in DBO Studio
Explore PostgreSQL workflows visually in DBO Studio — schemas, queries, and plans in one place.
Our newsletter
Subscribe to DBO Studio’s newsletter for exclusive tutorials, tips & product updatesRelated posts