- Introduction
- What the PostgreSQL Query Planner Does
- Planning Pipeline: Parsing, Rewriting, and Planning
- How the Planner Estimates Costs with Statistics
- Join and Scan Strategy Selection
- Why the Planner Picks a Bad Plan (and How to Fix It)
- Verifying Plans with EXPLAIN and EXPLAIN ANALYZE
- Key Takeaways
- Conclusion
- FAQ
TL;DR
The PostgreSQL query planner takes a parsed, rewritten query tree and searches for the cheapest execution plan using table statistics and a cost model. It estimates row counts with data from pg_statistic, prices each scan and join strategy, and explores join orders before handing the best plan to the executor. When estimates go wrong — usually due to stale statistics or misleading cost parameters — you get bad plans. EXPLAIN ANALYZE shows you where reality diverged from the estimate.
Introduction
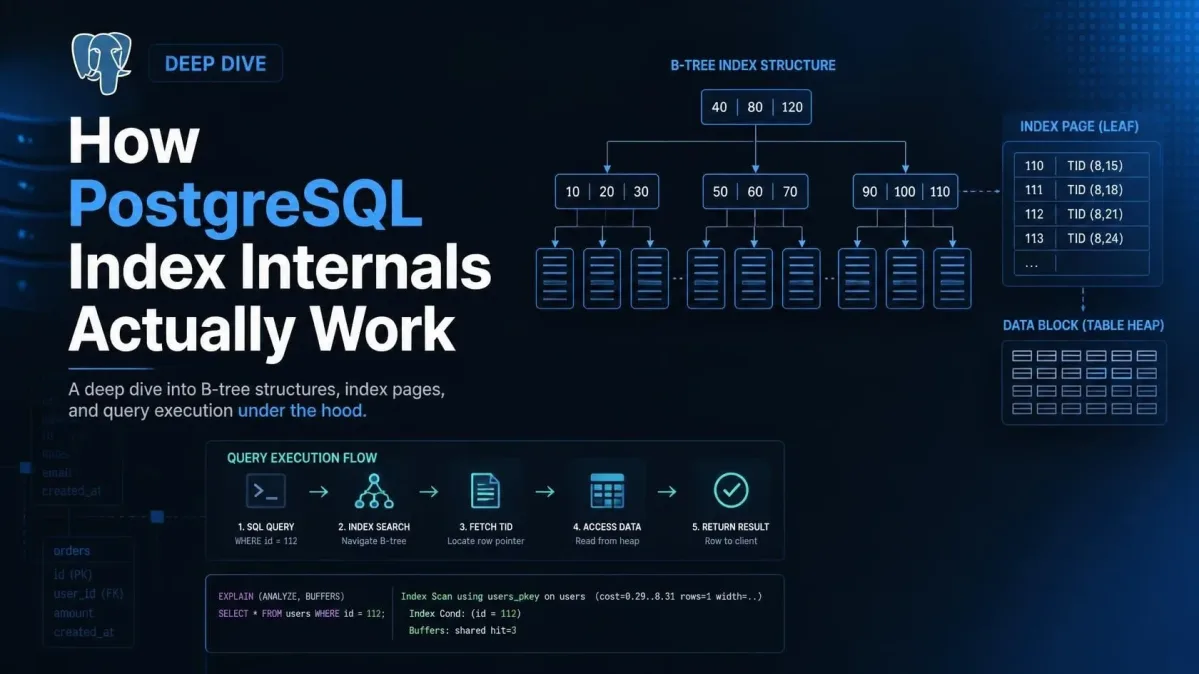
When you send a SQL statement to PostgreSQL, the server does not simply run it the way you wrote it. The PostgreSQL query planner (also called the optimizer) decides how the query runs: which indexes to use, which tables to join first, and which join algorithm to apply. For a simple single-table query there may be a handful of candidate plans; for a ten-table join there are billions of possible join orders. The planner exists to search that space quickly and return a plan whose estimated cost is low enough to execute well in practice.
This article walks through how postgres query planner works end to end: the execution plan stages from parsing to planning, how row estimation and cost estimation work, how the planner picks scan and join strategies, and what to do when it picks the wrong one. Understanding this model makes EXPLAIN output far less mysterious — you stop reading plans as verdicts and start reading them as the planner's reasoning, which you can then influence.
What the PostgreSQL Query Planner Does
Planner vs optimizer: same component, two names
PostgreSQL documentation uses "planner" and "optimizer" interchangeably. Both refer to the component that transforms a semantically valid query tree into an executable plan tree. The plan is a tree of plan nodes — scans, joins, sorts, aggregations — that the executor runs bottom-up.
The planner's job is optimization under uncertainty. It never knows exactly how many rows a predicate will match; it estimates. Nearly every confusing plan decision traces back to an estimate, not the plan-selection logic itself.
From SQL text to execution plan: the pipeline
The PostgreSQL execution plan stages are roughly:
- Parsing — the SQL text is tokenized and parsed into a parse tree; semantic analysis resolves table and column names against the system catalogs.
- Rewriting — the query tree is transformed by the rule system: views are expanded inline, row-level security policies are applied, and prepared-statement parameters get handled here.
- Planning — the planner enumerates feasible plans, estimates the cost of each, and picks the cheapest.
- Execution — the executor runs the plan tree and returns rows.
Steps 1 and 2 happen once per query; step 3 is where all the interesting decisions live.
Planning Pipeline: Parsing, Rewriting, and Planning
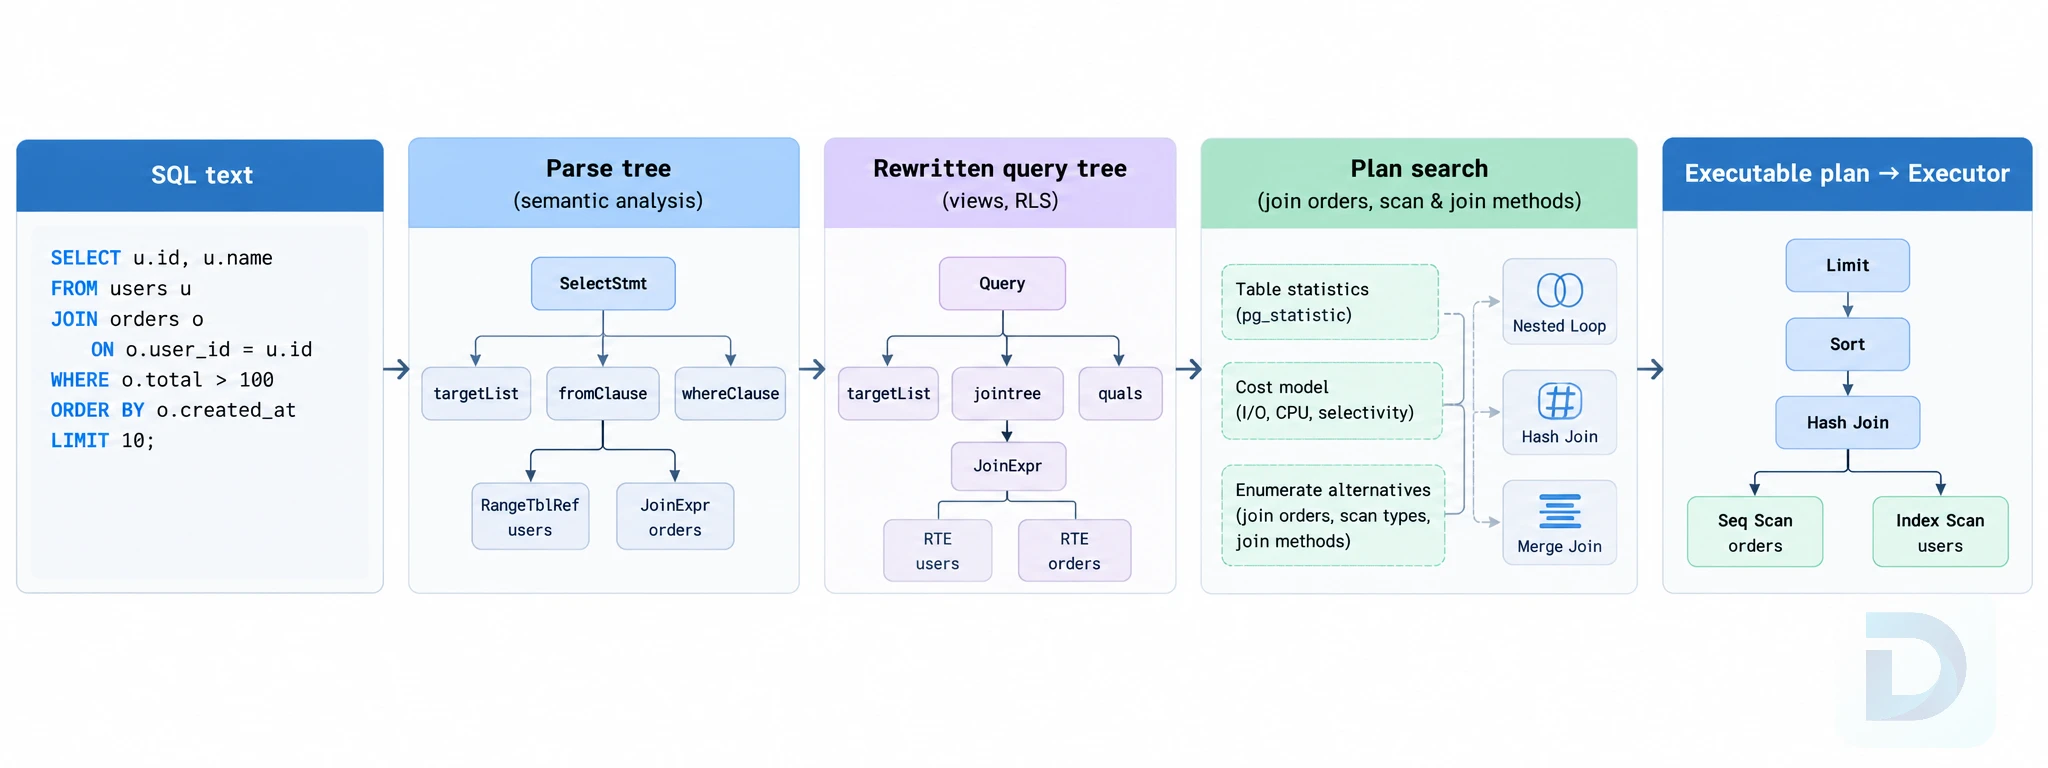
The PostgreSQL query processing pipeline: SQL text is parsed, rewritten, and planned before execution begins.
Parse tree and semantic analysis
The parser produces a parse tree that represents the query structurally — no optimization has happened yet. Semantic analysis then checks that referenced tables and columns exist, resolves types, and expands * into an explicit column list. The output is a query tree the planner can reason about.
If the query references a view, the view's definition is substituted directly into the query tree. This is why views are sometimes called "stored queries": from the planner's perspective, after rewriting there is no difference between a query against a view and the expanded SQL.
Rule-based rewriting (views, RLS)
The rewrite phase applies deterministic transformations before any cost-based decisions:
- View expansion — view references are replaced with their defining queries.
- Row-level security — RLS policies are injected as implicit filter conditions.
- Constant folding and simplification — trivially false conditions like
WHERE falseshort-circuit planning entirely.
Importantly, the rewriting phase does not reorder joins or push predicates based on cost. That is the planner's job, done differently.
Plan search: why the planner explores join orders
For a join of N tables, the number of possible join orders grows factorially, and each order can be combined with different join algorithms and scan methods. The planner cannot exhaustively price every plan for large joins, so it uses a dynamic-programming search for small numbers of relations (controlled by from_collapse_limit and join_collapse_limit, both 8 by default) and switches to the genetic query optimizer (GEQO) above geqo_threshold (default 10 relations). GEQO trades optimality for planning speed — it finds a reasonable plan without examining the whole search space.
Each candidate sub-plan is priced with the same cost model described below, and the cheapest complete plan wins.
How the Planner Estimates Costs with Statistics
pg_statistic and ANALYZE: where row estimates come from
The planner's estimates come from table statistics stored in pg_statistic (exposed more readably through the pg_stats view). The ANALYZE command samples each table and records:
- Row count and page count — used for sequential scan cost.
- Per-column statistics — most common values (MCVs) with their frequencies, a histogram of non-MCV values, the number of distinct values (n_distinct), the fraction of nulls, and physical correlation.
- Cross-column dependencies — when extended statistics (
CREATE STATISTICS) are defined.
Autovacuum triggers ANALYZE automatically: a table becomes eligible once at least autovacuum_analyze_threshold rows (default 50) plus autovacuum_analyze_scale_factor × table size (default 10%) have been modified since the last analyze. After a bulk load or a large update, running ANALIZE manually — precisely, ANALYZE your_table; — refreshes the postgres planner statistics immediately instead of waiting for autovacuum.
Selectivity, distinct counts, and correlation
Given a predicate, the planner computes its selectivity: the estimated fraction of rows that match. For WHERE status = 'active', it checks whether 'active' appears in the MCV list and uses the recorded frequency. For range predicates like WHERE created_at > now() - interval '7 days', it interpolates on the column histogram. Selectivity × estimated row count = the row estimate you see in EXPLAIN output.
Two common estimation pitfalls:
- Independent-column assumption — unless you define extended statistics, the planner multiplies individual selectivities, which badly underestimates rows when columns are correlated (e.g.,
cityandzip_code). - Non-constant comparisons — predicates against volatile expressions or values the planner cannot sample (like a bind parameter at planning time with no generic plan) degrade selectivity estimates to defaults.
The correlation statistic matters for index scans: it measures how well the physical row order matches the index order. High correlation means an index scan reads heap pages mostly sequentially — cheap. Low correlation means the planner may estimate expensive random I/O even when a plain EXPLAIN suggests the index "should" be used.
Cost model: cpu_tuple_cost, random_page_cost, and I/O assumptions
The PostgreSQL cost model expresses each plan's total cost as a weighted sum of I/O and CPU work. The key planner cost parameters postgresql ships with by default:
| Parameter | Default | What it represents |
|---|---|---|
seq_page_cost | 1.0 | Cost of reading one page sequentially (the baseline unit) |
random_page_cost | 4.0 | Cost of a random heap-page fetch |
cpu_tuple_cost | 0.01 | CPU cost of processing one row |
cpu_index_tuple_cost | 0.005 | CPU cost of processing one index entry |
cpu_operator_cost | 0.0025 | CPU cost of evaluating an operator or function |
effective_cache_size | 4GB (varies) | Planner's assumption about the OS/database cache available for caching data |
These are relative costs, not real units. random_page_cost at 4.0 reflects assumptions about spinning disks; on modern SSDs or NVMe where random reads are nearly as cheap as sequential ones, operators commonly lower it (1.1–2.0) so the postgresql cost model stops discouraging index scans. effective_cache_size doesn't allocate anything — it tells the planner how much of the table is likely already cached, which changes whether repeated heap visits look expensive.
Costs are estimates of work, not time. A plan with cost 500 is expected to do roughly half the work of a plan costing 1000 on the same data.
Join and Scan Strategy Selection
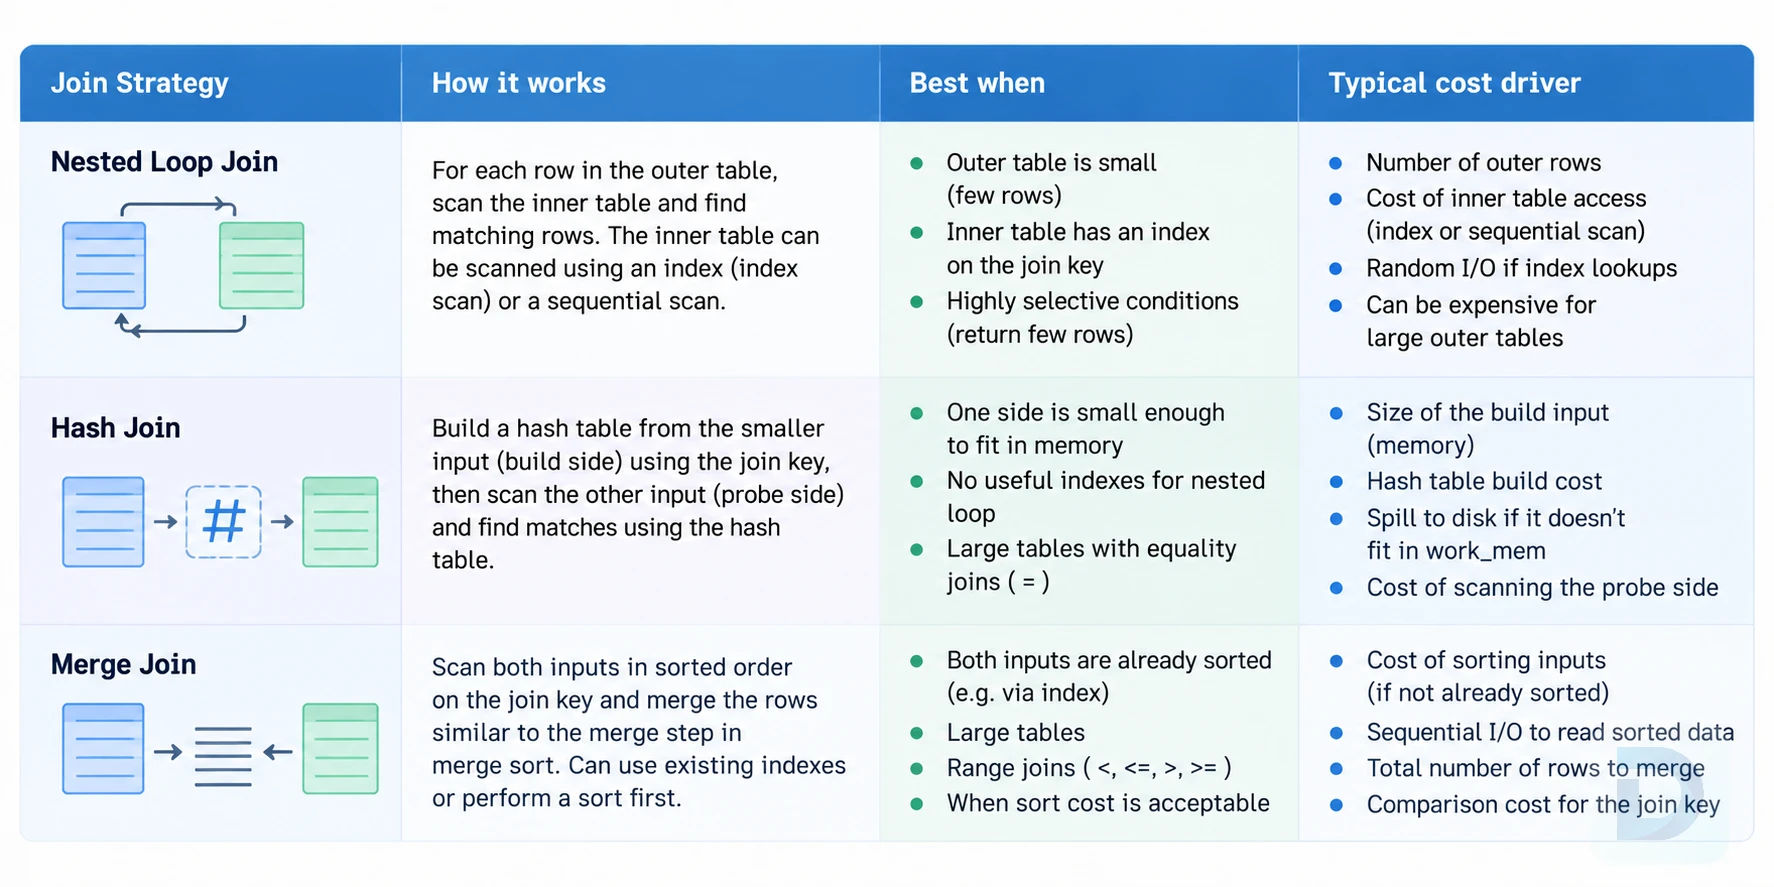
Join algorithms the planner can choose, with typical cost drivers and best-fit scenarios.
Sequential scan vs index scan vs bitmap scan heuristics
For each table access, the planner weighs three main options:
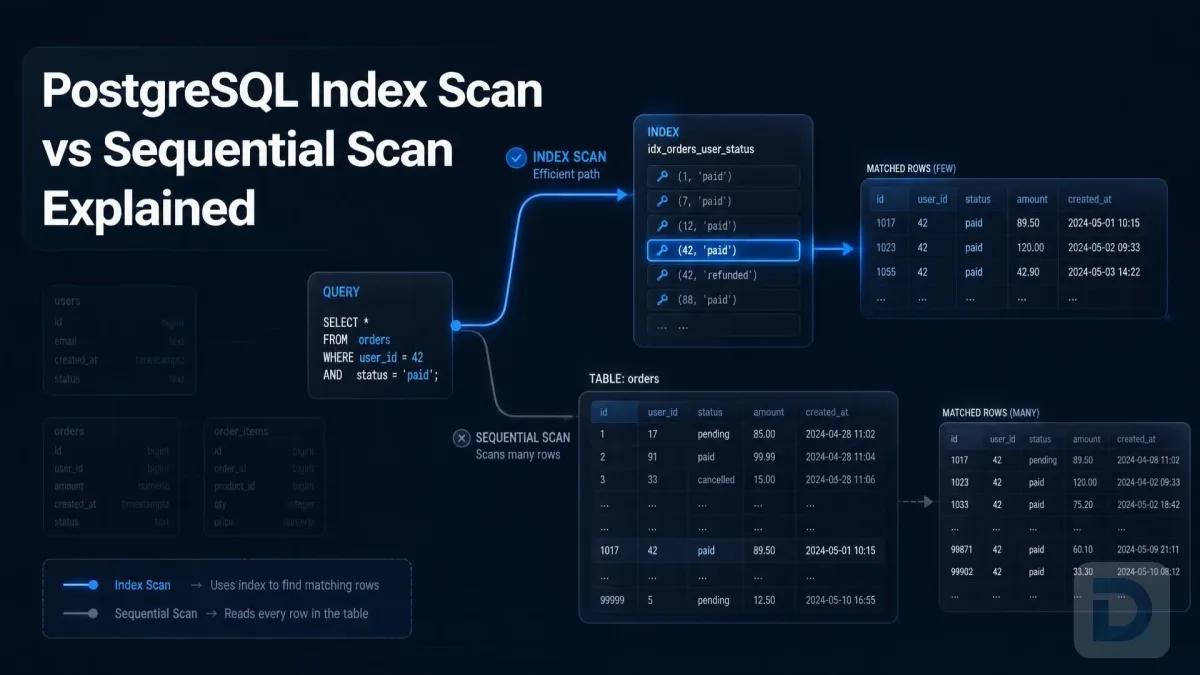
- Sequential scan — read every page once. Cheap per row, no randomness. Wins when the query matches a large fraction of the table (rule of thumb: often somewhere in the 5–20% range, though it depends heavily on row width and correlation).
- Index scan — walk a B-tree and fetch matching heap rows. Wins for selective predicates where the index order matches the heap (high correlation), or when the query needs ordered output the index already provides.
- Bitmap heap scan — scan the index to build a bitmap of matching pages, then read the heap pages in physical order. Wins in the middle ground: more selective than a sequential scan is worthwhile, but too many matches for cheap random index fetches. The bitmap also loses row-ordering, so an extra sort node may appear.
The boundary between these is not a fixed percentage — it falls out of the cost model. We compare these scan types in depth in our guide to index scan vs sequential scan.
Nested loop vs hash join vs merge join
The query planner join algorithms available are:
- Nested loop join — for each outer row, probe the inner side. Cheapest when the outer side is small and the inner probe uses an index. Catastrophically bad for large unindexed inputs.
- Hash join — build an in-memory hash table from one side, probe it with the other. The workhorse for large unsorted joins without useful indexes.
- Merge join — sort both inputs (or use index order) and merge. Can win when inputs are already sorted or the output needs sorted order, and it can stream results.
The planner prices each combination of join algorithm and join order and picks the cheapest — but only as cheap as its row estimates are accurate. A nested loop estimated to probe 100 outer rows but actually probing 1,000,000 is the classic symptom of a bad estimate, not a bad algorithm.
Join order search and the genetic query optimizer (geqo)
Within a join, the planner evaluates orders left-deep and bushy, collapsing subqueries and reordering joins per join_collapse_limit. Beyond geqo_threshold relations, GEQO uses a genetic algorithm: it evolves a population of candidate join orders over a few generations instead of searching exhaustively. This keeps planning time bounded for wide queries at the cost of plan quality — if a 20-table query produces an odd plan, GEQO is a likely suspect, and tuning geqo_effort (or restructuring the query) is a reasonable response.
Why the Planner Picks a Bad Plan (and How to Fix It)
Stale or missing statistics
Most bad plans trace back to bad row estimates. Typical causes:
- Freshly loaded or bulk-updated tables that haven't been analyzed yet — run
ANALYZEexplicitly. - Autovacuum hasn't caught up on a large, rapidly changing table — consider lowering per-table
autovacuum_analyze_scale_factor. - Skewed data the uniform histogram can't represent — define extended statistics with
CREATE STATISTICS ... (dependencies, mcv)for correlated columns. - Functions wrapping columns (
WHERE date(created_at) = ...) block selectivity use and index use; rewrite as range predicates where possible.
Diagnose with EXPLAIN: compare rows=... estimates against actuals from EXPLAIN ANALYZE. Estimates off by orders of magnitude are the smoking gun. Our step-by-step PostgreSQL query optimization guide covers this workflow in detail.
Configuration parameters that skew decisions
Wrong defaults on the planner cost parameters produce systematically wrong plans:
random_page_costtoo high for SSD storage → planner avoids index scans it should use.effective_cache_sizeset far below actual memory → planner overestimates I/O for repeated page reads.work_memtoo low → hash joins spill to disk, making hash plans look worse than they are.default_statistics_target(default 100) too low for skewed columns → coarse histograms; raise it per-column withALTER TABLE ... ALTER COLUMN ... SET STATISTICS n.
These are session-settable, so you can experiment with SET random_page_cost = 1.1; and re-run EXPLAIN to see whether the plan changes before committing anything to postgresql.conf.
Hints, CTE materialization, and planner workarounds
PostgreSQL has no native hint syntax (extensions like pg_hint_plan exist, but they're third-party). Instead, use supported constructs:
MATERIALIZED/NOT MATERIALIZEDCTE modifiers (PG12+) — control whether a CTE becomes an optimization fence or is inlined like a subquery. Before PG12, CTEs were always optimization fences, which is why old tuning advice says "CTEs block the planner."OFFSET 0in a subquery — a documented side effect that prevents predicate pushdown into that subquery, useful in a pinch.- Query restructuring — rewrite joins, split a wide query into steps with temp tables, or replace a view with the expanded SQL when view inlining produces a pathological plan.
pg_prewarmand correct data modeling — sometimes the fix is a better index; our guides on PostgreSQL index internals and the PostgreSQL indexing guide cover the options.
Treat workarounds as diagnostics: if you need a workaround, there's almost always an estimate or a cost parameter behind the misbehavior worth investigating.
Verifying Plans with EXPLAIN and EXPLAIN ANALYZE
Reading estimated vs actual rows
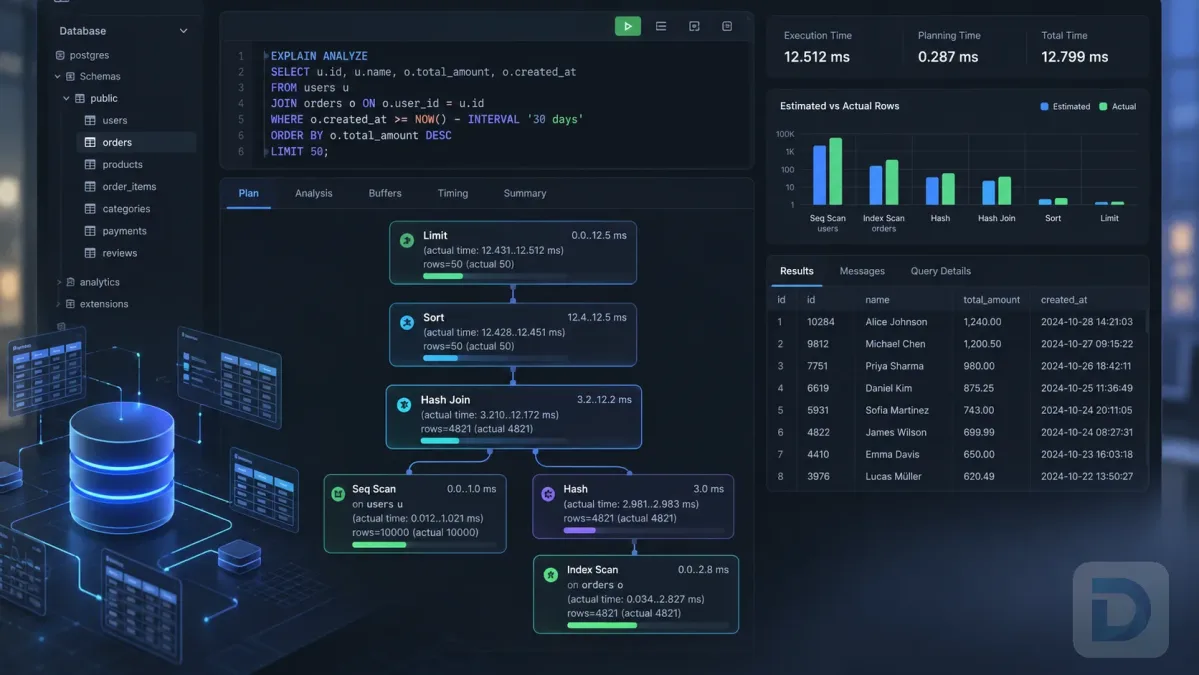
EXPLAIN shows the plan and its costs without running the query; EXPLAIN ANALYZE actually executes it and reports actual rows, loops, and timing per node:
EXPLAIN ANALYZE
SELECT o.id, o.total
FROM orders o
JOIN customers c ON c.id = o.customer_id
WHERE c.country = 'DE'
  AND o.created_at >= '2024-01-01';
Read each node as: cost=startup..total rows=estimate width=... plus, with ANALYZE, actual time=... rows=actual loops=n. A node executed many times shows per-loop rows, so multiply by loops to get real totals — a frequent source of misreading.
Common red flags in plan output
- Estimated vs actual rows off by 10× or more at any node — statistics or selectivity problem.
- Nested loop with huge actual row counts on the inner side — bad estimate, or a missing inner-side index.
- Sort nodes on large row counts — check whether an index could supply the order, or whether
work_memforced an external merge (watch forSort Method: external merge). - Bitmap heap scan with a high
Heap Blocks: exactcount relative to rows — the index is not very selective, or correlation is poor. Rows Removed by Filterdominating a scan — a sequential scan doing most of its work discarding rows; often a missing or unusable index.
Key Takeaways
- The PostgreSQL query planner transforms a rewritten query tree into a plan tree, choosing the cheapest plan by a relative cost model — not by rules or by your SQL's wording.
- Row estimates come from
pg_statistic, populated byANALYZEand autovacuum. Nearly every bad plan starts as a bad estimate. - The planner compares sequential, index, and bitmap scans and nested loop, hash, and merge joins per candidate, exploring join orders with dynamic programming or GEQO for wide queries.
- Fix bad plans in this order: run
ANALYZE, check estimate vs actual divergence, then review cost parameters (random_page_cost,effective_cache_size), and only then reach for workarounds.
Conclusion
The planner is not an oracle and not an enemy — it is a cost-based search engine working from sampled statistics and fixed assumptions. Once you understand how postgres query planner works, every EXPLAIN output becomes a readable argument: here is my estimate, here is my pricing, here is why I chose this path. When the argument is wrong, you now know where to look: refresh the statistics, check the cost parameters against your hardware, and verify with EXPLAIN ANALYZE. Combined with the indexing and optimization guides on this site, that loop — estimate, measure, correct — covers the majority of real-world PostgreSQL performance work.
FAQ
Yes. PostgreSQL documentation uses "planner" and "optimizer" interchangeably — the component that transforms a parsed and rewritten query tree into an executable plan.
The autovacuum daemon runs ANALYZE when a table's change threshold is exceeded (10% of rows by default, plus a flat threshold of 50 rows). You can also run ANALYZE manually after large data changes to refresh pg_statistic immediately.
The planner estimated that reading the whole table is cheaper — usually because the query matches a large fraction of rows, statistics are stale, or low correlation between heap order and index order makes random access expensive. Compare EXPLAIN estimates against actual rows before concluding the planner is wrong.
Generic plans are cached for prepared statements and PL/pgSQL queries, while ad-hoc queries are replanned on each execution. PostgreSQL can switch from a custom to a generic plan after several executions if the generic plan's average estimated cost is not worse.
An alternative search strategy the planner uses when a query joins more tables than geqo_threshold (default 10). Instead of exhaustive dynamic programming, GEQO uses a genetic algorithm to find a good — not necessarily optimal — plan quickly, keeping planning time bounded for wide queries.
About the author

Founder & Lead Developer at DBO Studio
Full-stack developer and creator of DBO Studio, a modern database management tool. Passionate about PostgreSQL, MySQL, SQLite, database performance, developer productivity, and building tools that simplify database workflows.
Try this in DBO Studio
Explore PostgreSQL workflows visually in DBO Studio — schemas, queries, and plans in one place.
Our newsletter
Subscribe to DBO Studio’s newsletter for exclusive tutorials, tips & product updatesRelated posts